Climate & field data
Weather context, farm records, plot observations, harvest measurements, and local knowledge.
TerraVIV
TerraVIV connects field evidence, UAV multispectral observation, handheld LiDAR, AI analysis, and local validation into decision-ready intelligence for agriculture, restoration, and carbon-readiness.
TerraVIV architecture
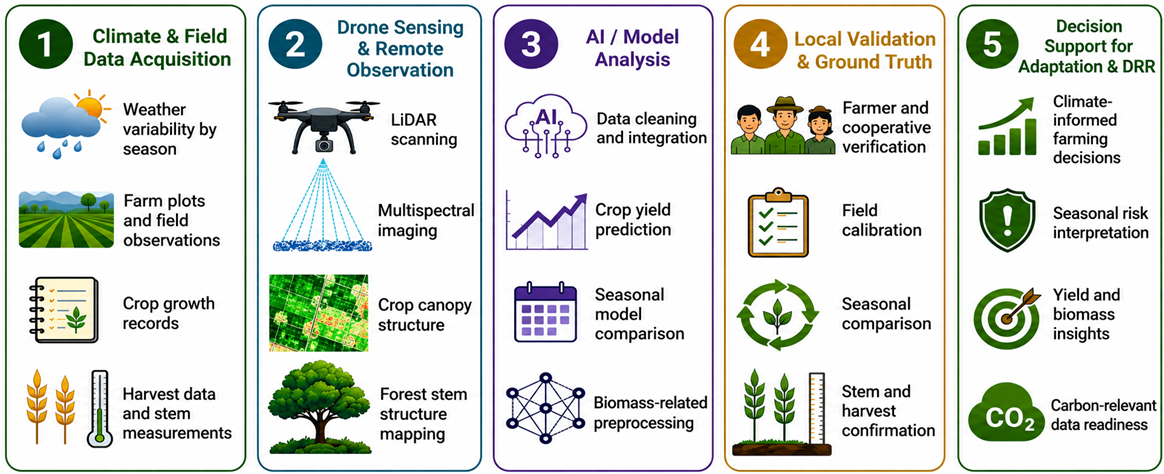
The platform is a shared workflow. Agriculture and forest studies use different sensors, but both move from sensing to structure, signal, validation, and decisions.
Weather context, farm records, plot observations, harvest measurements, and local knowledge.
UAV multispectral imagery for crops and handheld LiDAR point clouds for forest structure.
Vegetation indices, yield models, point-cloud segmentation, and seasonal model comparison.
Ground truth, farmer and field partner review, harvest confirmation, and site-specific calibration.
Yield-risk assessment, biomass verification, adaptation planning, and carbon-readiness support.
Architecture focus
TerraVIV starts from local conditions and field observations so that remote sensing is tied to real-world ground truth rather than treated as a standalone data layer.
End-to-end workflow
The workflow connects climate and field evidence, remote sensing, AI analysis, local validation, and decision support for both agriculture and forest landscapes.
Case studies
Sweet corn yield prediction demonstrates crop productivity intelligence. Forest stem segmentation demonstrates biomass and carbon intelligence.
Agri case study
UAV multispectral imagery and field measurements were transformed into VI features and plot-level yield estimates. The current recommended workflow trains on Winter samples and tests transfer to Rainy plots.
Research method
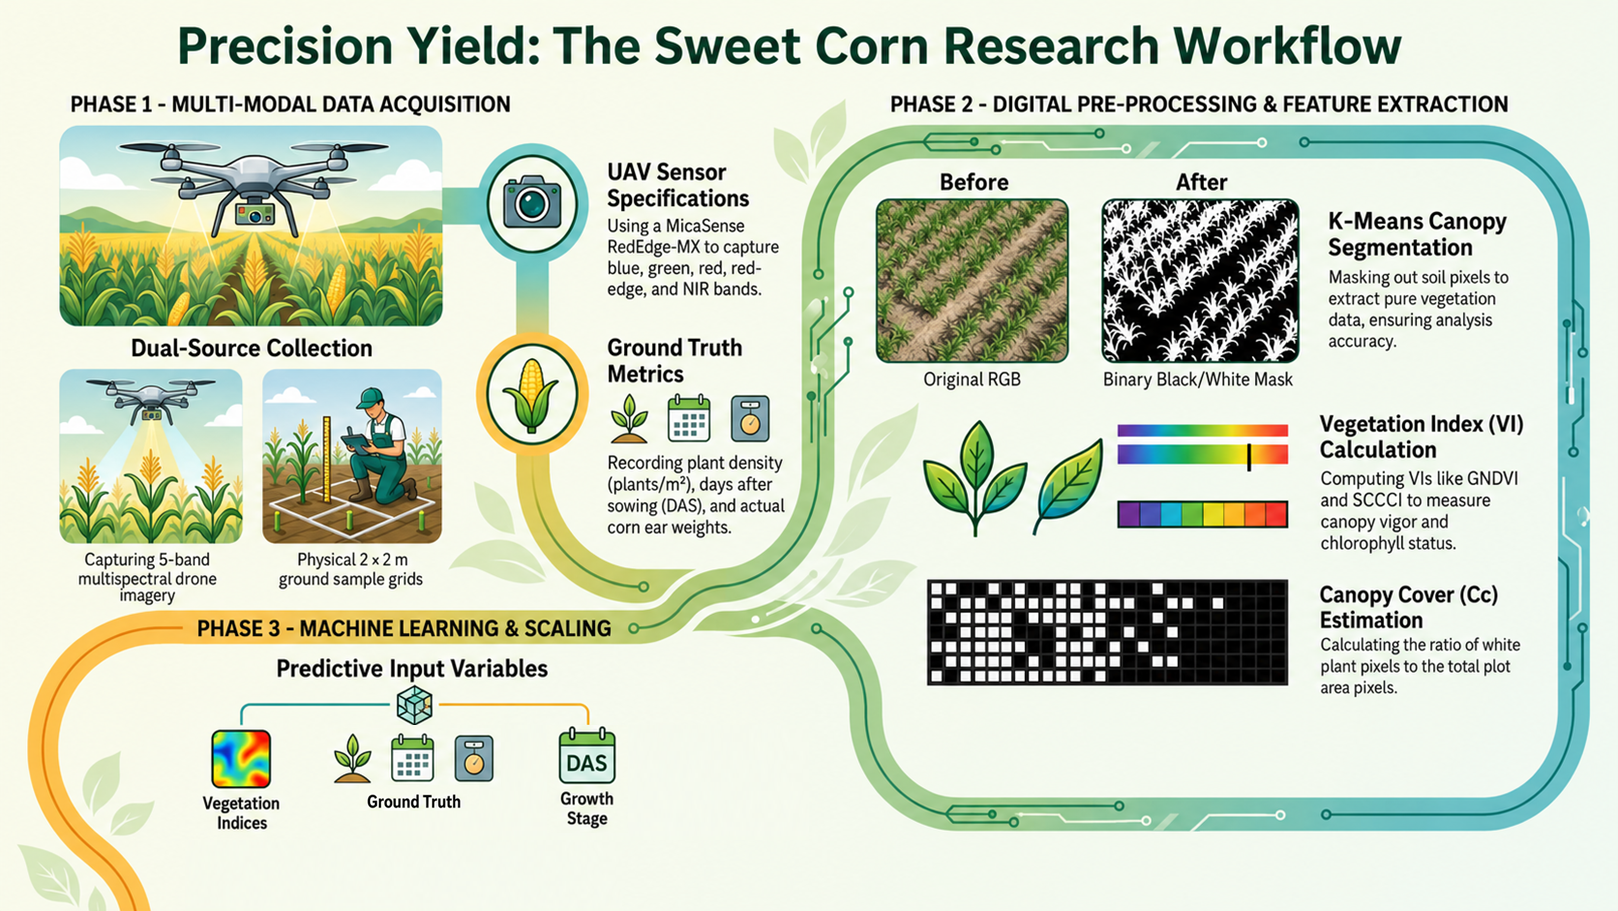
The study combines five-band UAV multispectral imagery, 2 x 2 m ground sample grids, plant density, days after sowing, and actual corn ear weights. Digital preprocessing uses K-means canopy segmentation, vegetation-index calculation, canopy-cover estimation, and machine-learning models to scale plant-level prediction into plot-level yield.
Seasonal signal
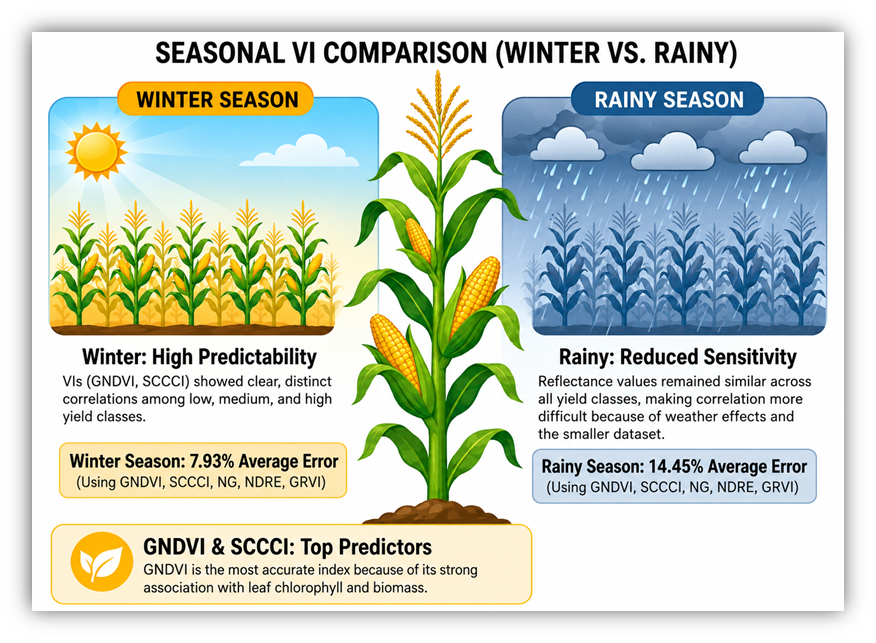
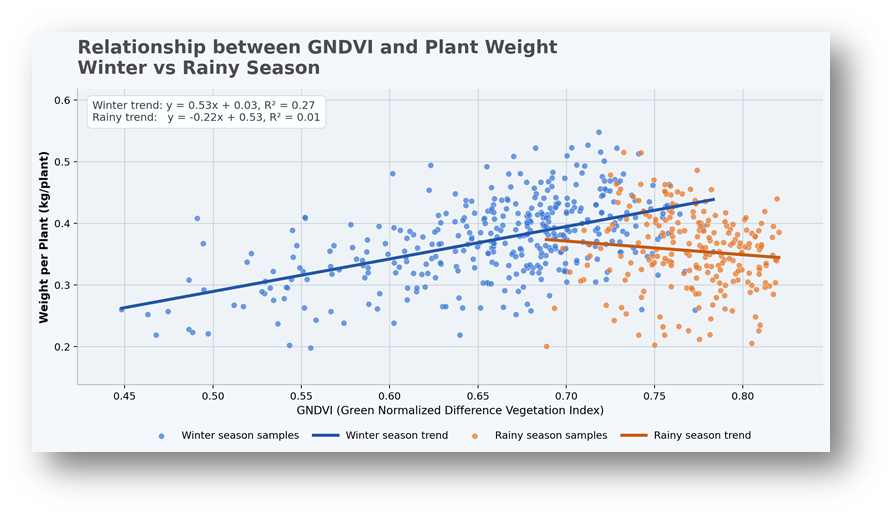
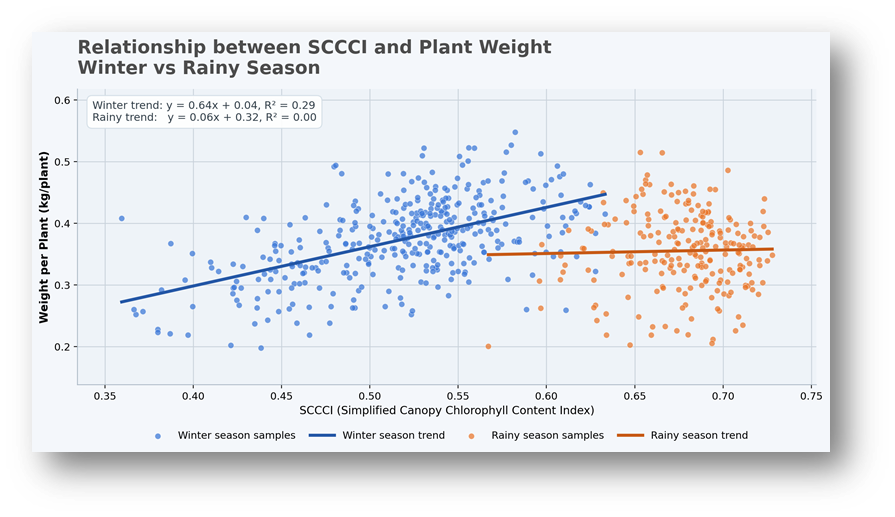
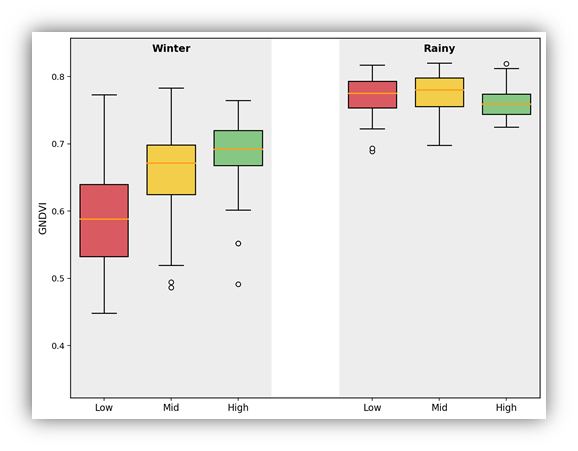
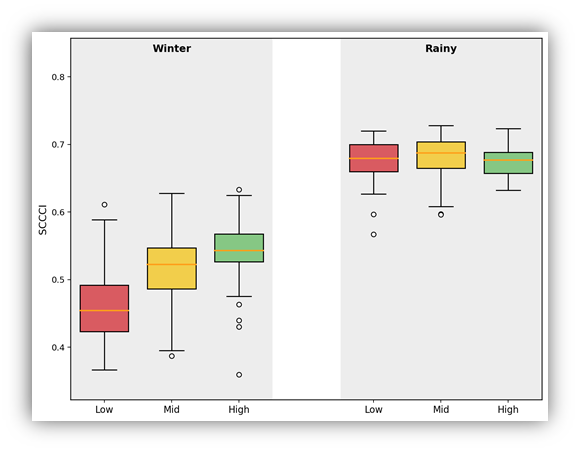
Winter samples showed clearer relationships between vegetation indices and yield classes. Rainy-season reflectance values were more compressed across classes, which made prediction more difficult and increased model error.
Vegetation-index evidence
Scatter plots show positive Winter trends between vegetation indices and plant weight. Rainy trends were weak or nearly flat, supporting the conclusion that season-specific calibration is needed before applying the model operationally across seasons.
Model results
Overall model comparison showed Random Forest with the lowest MAPE at 10.51%, with Gradient Boosting close at 10.56%. By season, the best Winter model was Random Forest with 7.93% MAPE, while the best Rainy model was Gradient Boosting with 14.45% MAPE.
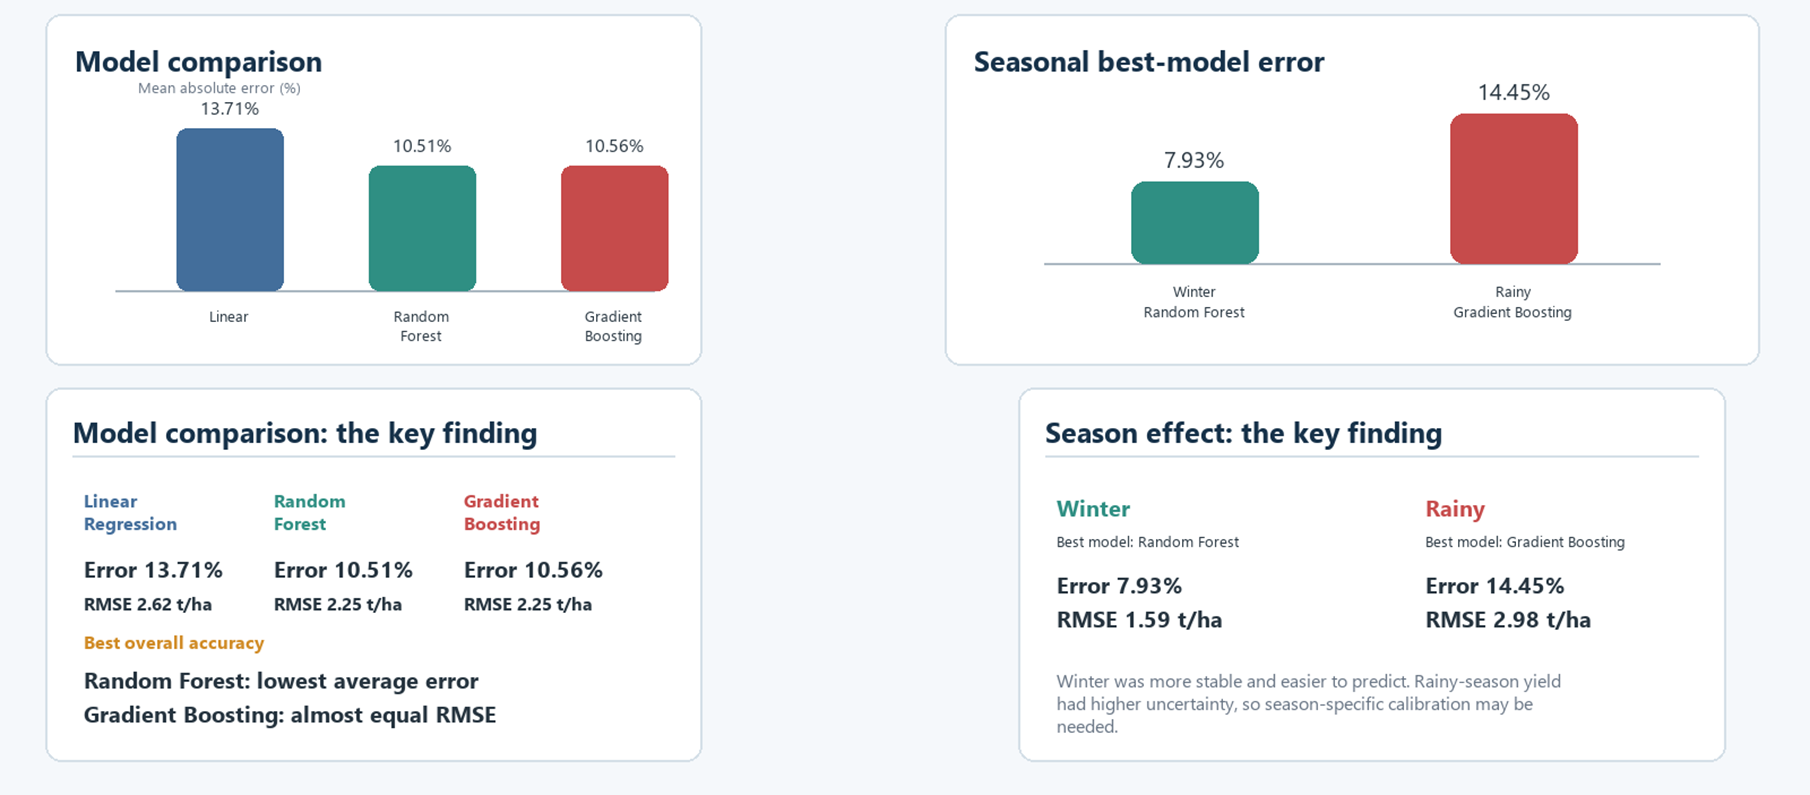
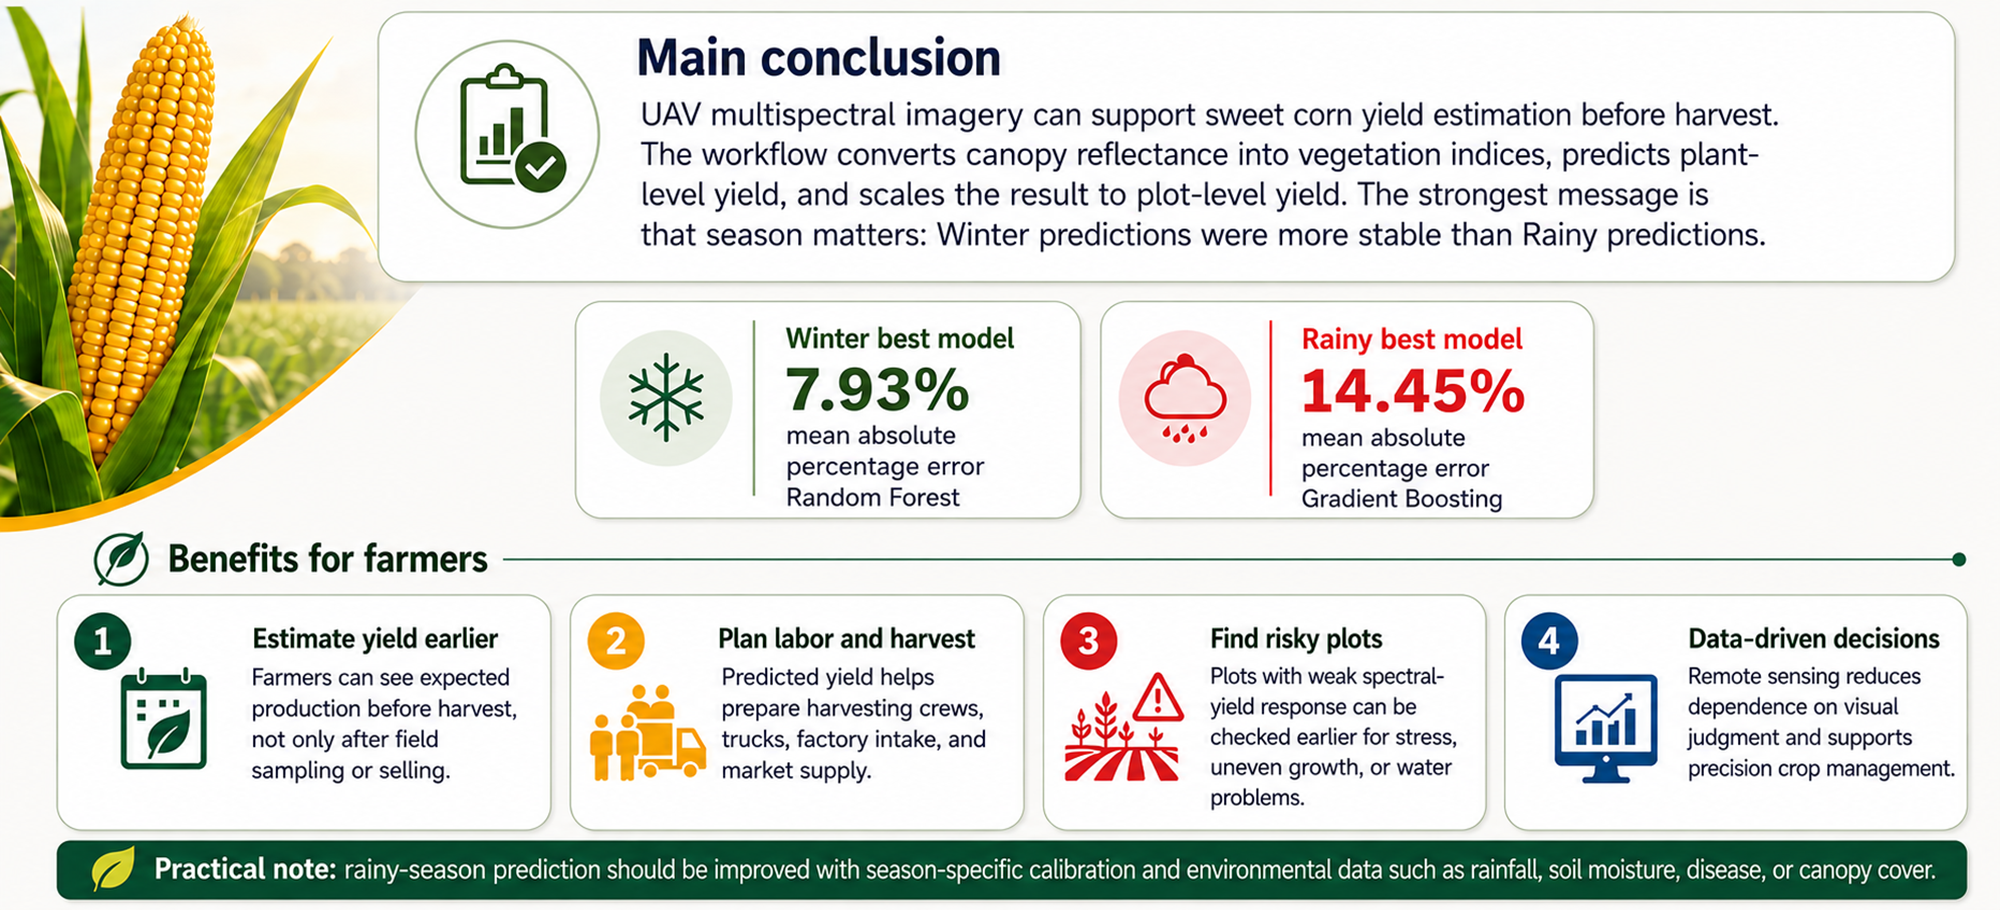
Key caution: Rainy-season prediction had higher uncertainty, so future deployment should improve season-specific calibration and add environmental variables such as rainfall, soil moisture, disease pressure, or canopy cover.
Forest case study
Handheld ZEB Horizon LiDAR point clouds are segmented into ground, stem, and vegetation classes, supporting downstream DBH, biomass, and carbon-related assessment.
Research method
The forest workflow starts with ZEB Horizon handheld LiDAR scans from Thai forest restoration plots. Point clouds are filtered, subsampled, tiled, labeled into ground, stem, and vegetation classes, then used to fine-tune PointNeXt-S/L and PointNet++ variants. HAG was tested as an optional feature, but it should not be described as a guaranteed improvement.
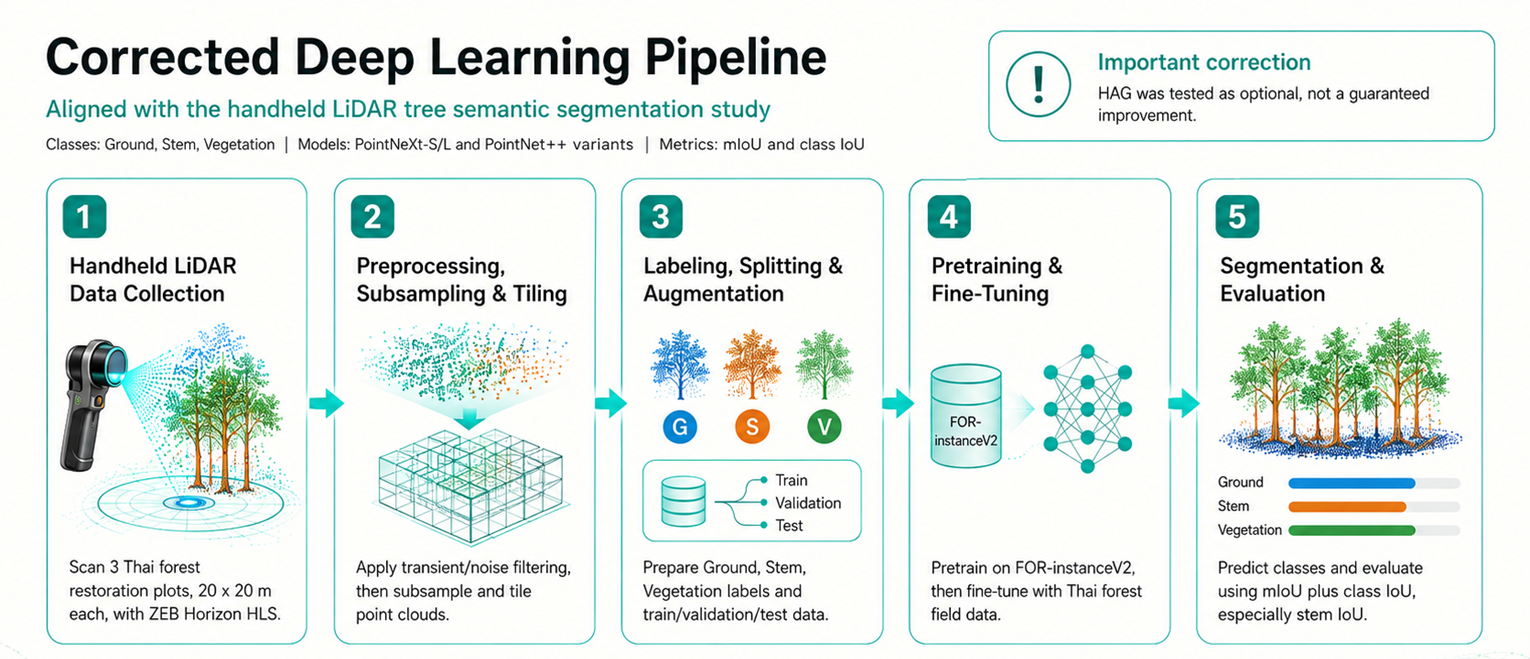
Poster Figure 5
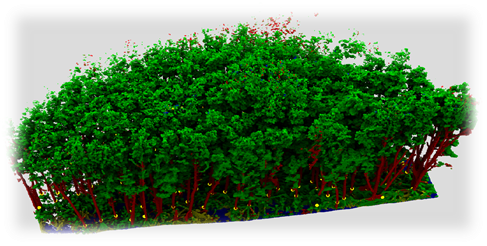
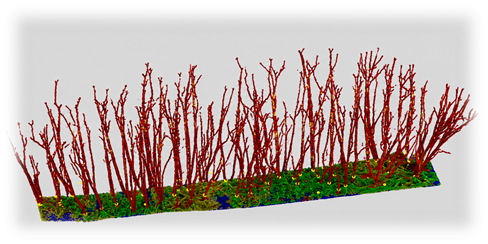
The original forest point cloud contains dense canopy and understory returns, making direct stem measurement difficult. After segmentation, stem points are isolated more clearly, providing the structural input needed for downstream DBH, biomass, and carbon-related analysis.
Result summary
PointNeXt-L achieved comparable performance with fewer parameters than the modified PointNet++ model in this study context. Reported mIoU was highest in dry evergreen forest, followed by mixed deciduous forest, while dry dipterocarp remained more difficult because dense vines and understory vegetation make stem-boundary segmentation harder.
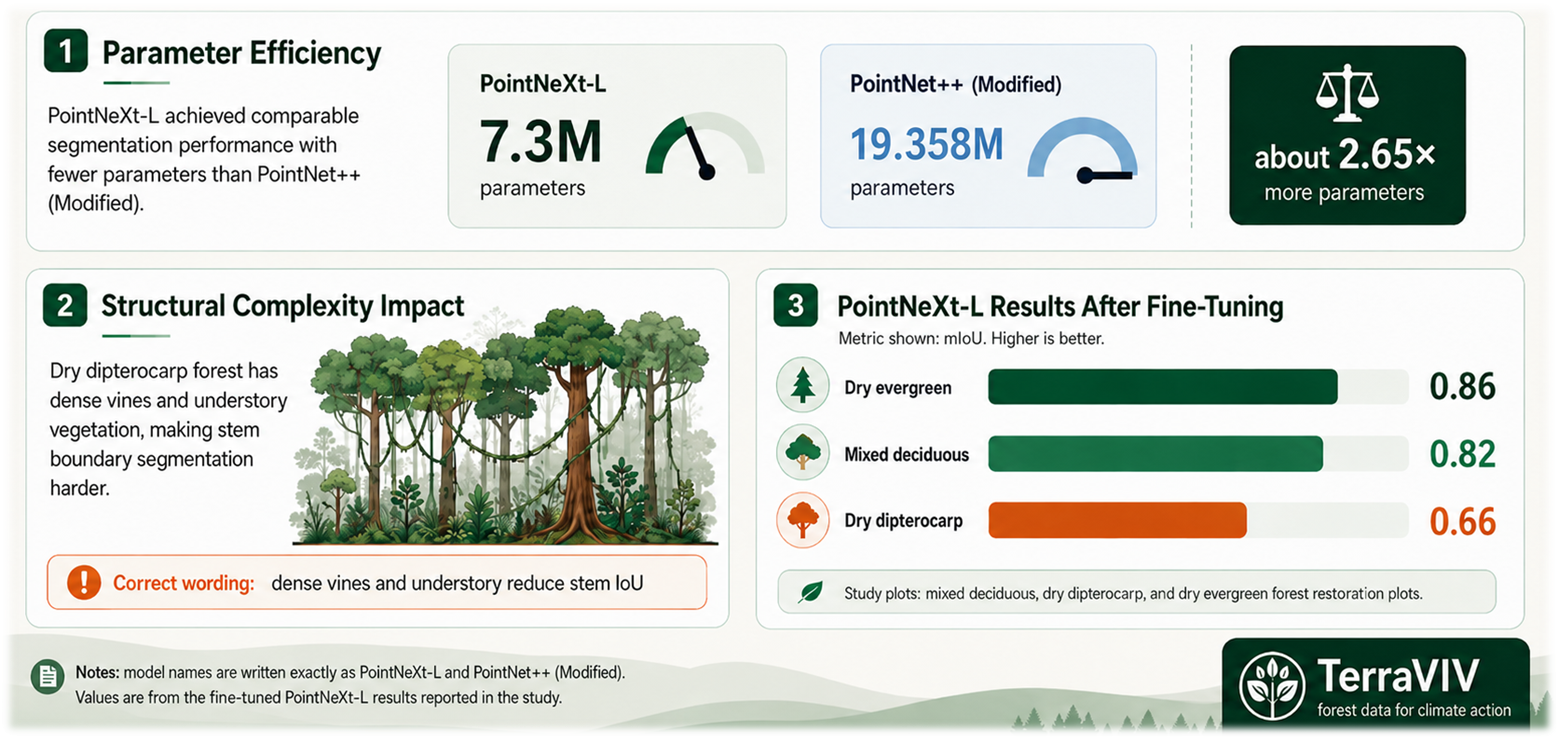
Reported PointNeXt-L mIoU: dry evergreen 0.86, mixed deciduous 0.82, dry dipterocarp 0.66. These values support stem segmentation as a foundation for biomass and carbon assessment, not as a completed carbon-stock estimate by itself.
Impact
TerraVIV is designed as a scientific and decision-support platform that helps transform local observations into trusted, actionable intelligence.
Support yield-risk assessment, seasonal comparison, and field-level planning before harvest.
Connect local climate conditions, field evidence, and sensing outputs for adaptive decisions.
Use forest structure data to reduce uncertainty in biomass and carbon-related assessment.
Keep local knowledge and field partners inside the evidence loop to build trust and relevance.
One platform, many applications
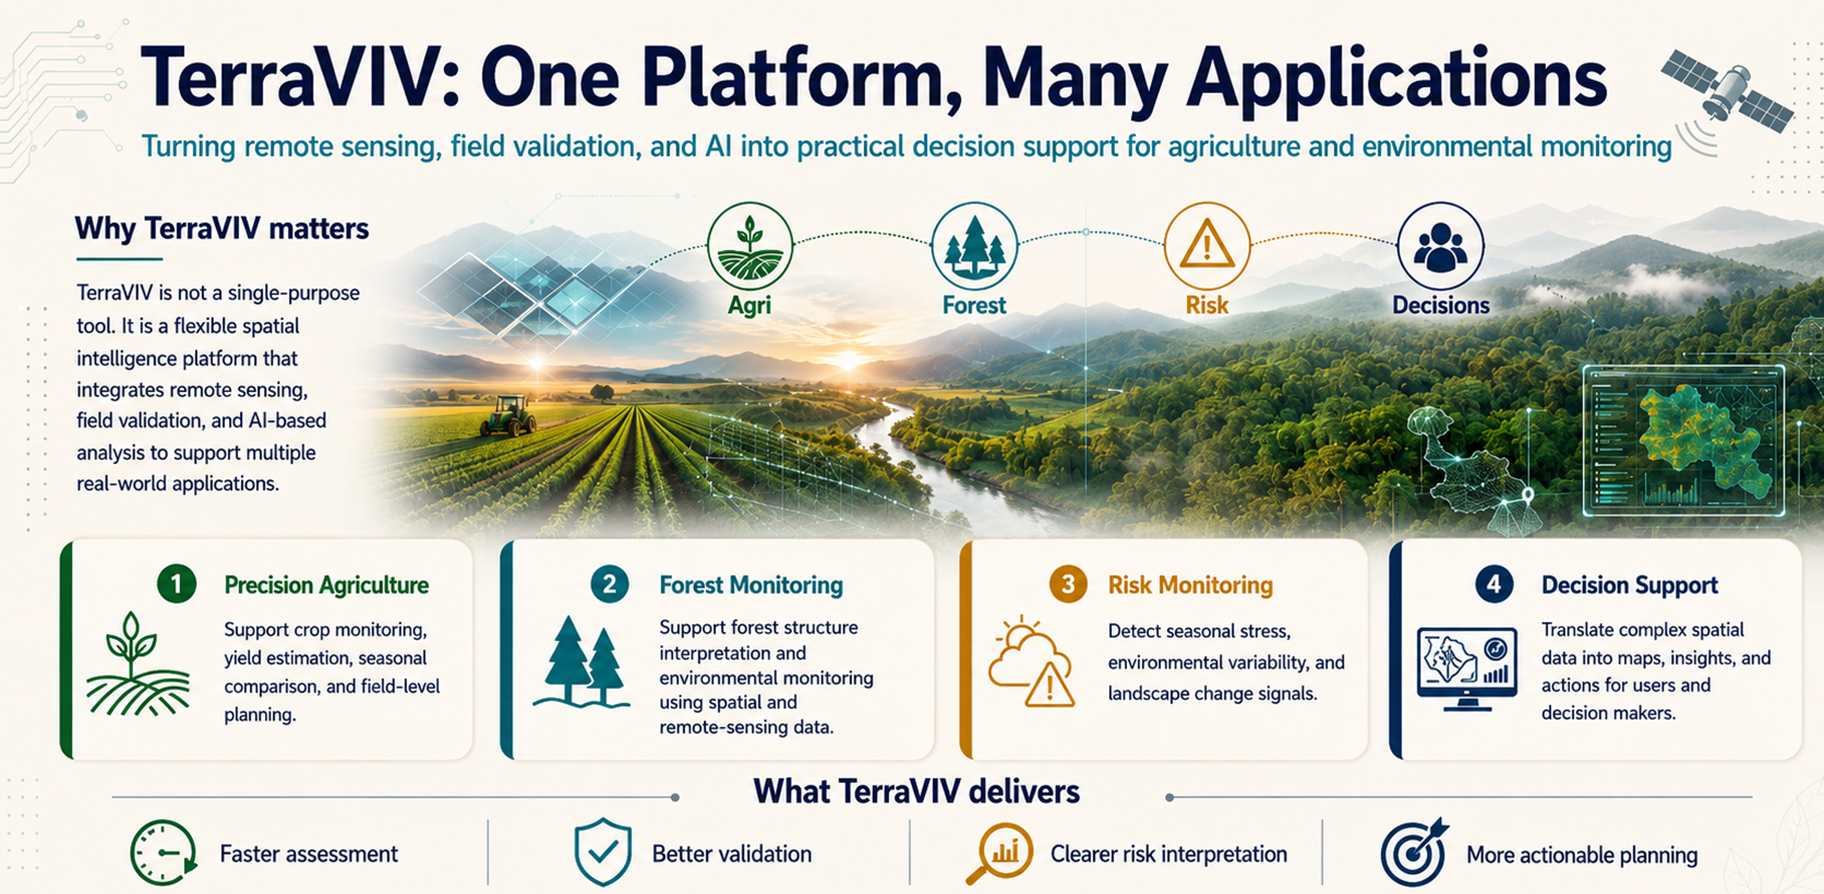
TerraVIV is not a single-purpose model. The same evidence pipeline supports sweet corn yield estimation, forest structure monitoring, seasonal risk interpretation, and decision-ready planning. The current research cases demonstrate the agriculture and forest parts of this broader platform.
Shared evidence loop
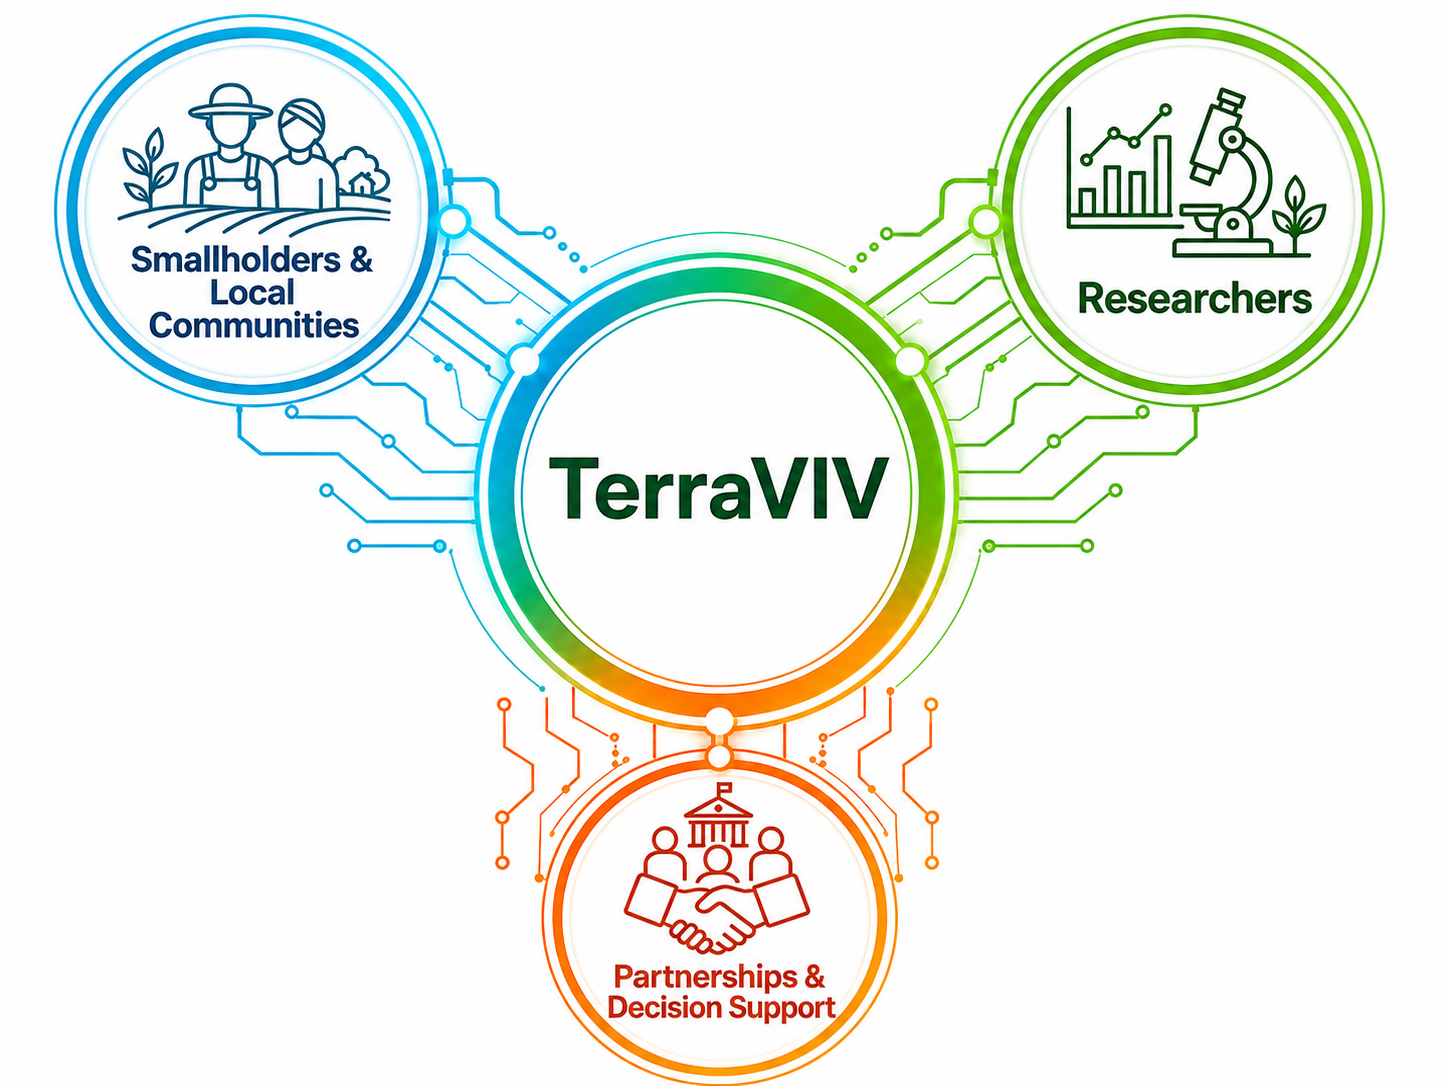
The platform links smallholders and local communities who provide field reality, researchers who build and test the models, and partners who translate results into planning, monitoring, and adaptation decisions. This is why local validation remains part of the workflow rather than an afterthought.
TerraVIV demo